Sunday, September 17, 2006
LUMPINI DEVELOPMENT PUBLIC COMPANY LIMITED
Disclaimer
The author has a stake in LPN. His opinion given in this article might be prejudiced although he has tried his best to maintain the neutral position. The data presented in this article is carefully verified by the author to ensure that it is as accurate as possible. However, he can’t ensure that there will not be any mistake. To use the information in the article for one’s own investing, the liability shall not be born to the author.
Lumpini Development Public Company Limited (LPN) has caught my attention around a year ago when it advertised its low-to-medium-price condominium project at Sukhumvit 77 on the sky trains. As one of its targeted group who looks for not-so-expensive condominium situated nearby the mass transit network like BTS and MRT, I started on my research four months ago to ascertain if this company is worth owning.
The Blue Ocean
In-house research team of LPN found out that the moderate-price condominiums in the range of 1-3 million Baht and located along the mass transit network route are in high demand but lack of supply. Its flagship projects in Sukhumvit 77 and Pahol-Suthisan area were sold out within a short period. Similar strategy adopted in Pinklao, Cultural Center and Rama 3 area is also successful in drawing out the targeted buyers. As the installment cost is closed to the renting cost, most people are more than willing to own one rather than rent one. The growing trend of Bangkokians to stay close to the office or the mass transit network in order to curtail their transportation cost indicates that the demand in this niche market would still be strong in the foreseeable future. Recent proof on this trend is that its newly launched project, Lumpini Place Pahol-Saphankwai, is in great demand from the buyers. The 30-35 sq.m rooms available during the pre-sale period are sold out within a few days. As the leader in this area, LPN expands its own territory of the huge Blue Ocean.
Competitive Advantage and Risk
LPN is one of the property developers having high efficiency in managing profitability, cost controlling and financial leverage. The operating profit margin is approximately 33% and net profit margin is around 18%. Its SG&A to Revenue Ratio is slightly more than 10%. Only two companies in the property development sector listed on SET achieve lower ratio than what LPN does. Its ROA and ROE stand more than 15% with D/E ratio of 0.63. LPN ranks within the top five companies in the property developer sector in terms of ROA, ROE and D/E.
The future success of LPN hinges very much on the location and price of potential land bank it acquires. A good relationship with financial institutions will make sure that the company has adequate resources for the future projects. Controlling the construction cost will play an important role in enhancing the company’s profitability.
Rising interest rate is probably a major factor prolonging the decision of the would-be buyers. High petrol price will decrease the purchasing power and hence distract the would-be buyers but at the same time will also trigger those who would like to save the transportation cost. The rising in construction materials will dent the company’s operating profit margin as well. Management has to manage the construction cost more carefully in order to maintain the profit margin.
Insofar, as the demand is still strong, I expect that the strategy the company employs will ultimately create the value for the shareholders.
Valuation
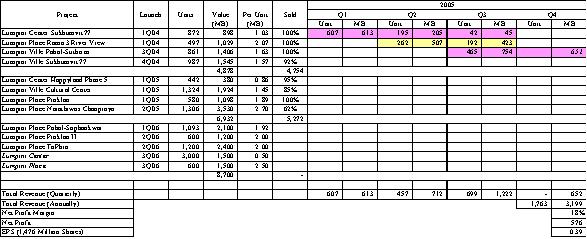
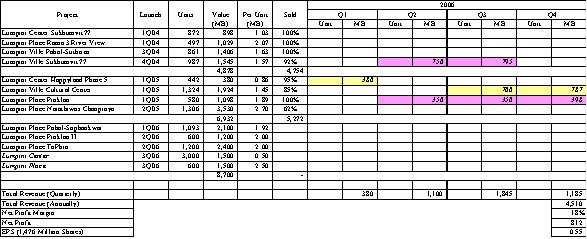
With reference to the Table 1 given below, LPN expects that it will recognize its revenue for fiscal year 2006 in the amount of 4,500 million Baht from its four projects launched last year which are over 90% sold out as of 31 Dec 2005. Assuming the net profit margin of 18%, the net profit for year 2006 will be 812 million Baht or 0.55 Baht per share. In addition, the sales volume for this year may top 8,000 million Baht.
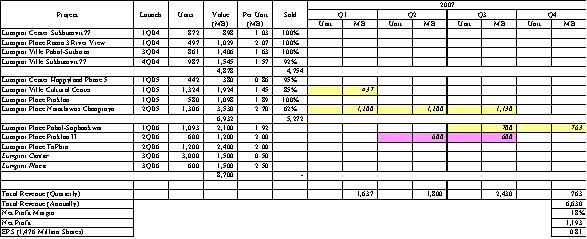
The company forecasts that in 2007 its revenue will reach 6,600 million Baht from the projects launched in year 2005 and 2006. Assuming that all units are sold out and the company can maintain its net profit margin at 18%, the net profit for year 2007 will be 1,188 million Baht or 0.80 Baht per year.
If the market values the company at 10 times its earning, the share price would reach 8 Baht in a few years. Given its high dividend payout at 50%, the shareholders would receive the aggregate dividend of 0.85 Baht (0.20, 0.25 and 0.40 for 2005, 2006 and 2007 respectively).
At the current price of 4.02 Baht (20 Jan 2006), the company looks very attractive and undervalued. Most brokerage analyst gives the company a fair value of around 4.40 Baht. But I’d rather prefer to think otherwise. Instead of buying a 30-sq.m room today, one might use that amount of money to purchase the company common stock and wait patiently till the gap between the share price and intrinsic value is closed. At the end, the capital gain and dividend received might translate into a 60-sq.m room.
The last word
I would like to emphasize that investing in this type of company the investor must monitor several figures such as the sales volume and the economic trend quite closely. This will ensure that the investor knows the red flags if occur before hand and is able to exit before others once things do not go as expected.
Saturday, September 09, 2006
Thai Rayon Public Company Limited (TR)
Disclaimer
The author has a stake in TR. His opinion given in this article might be prejudiced although he has tried his best to maintain the neutral position. The data presented in this article is carefully verified by the author to ensure that it is as accurate as possible. However, he can’t ensure that there will not be any mistake. To use the information in the article for one’s own investing, the liability shall not be born to the author.
Business Nature
Thai Rayon (TR) is listed in the Stock Exchange of Thailand (SET) since 1994 and is under fashion and textile industrial sector.
The main business of TR is producing and selling rayon which is used as the raw material for spun yarn, clothes and non-woven products such as diaper etc. It is the sole rayon producer in Thailand, with annual sales of 80,000 MT of rayon worth 5 billion Baht. Under the umbrella of Aditya Birla Group, an Indian conglomerate, TR is positioned to manufacture the high-grade rayon. One-third of rayon production capacity worldwide belongs to Aditya Birla Group.
In addition to rayon business, the company invests in associated companies which synergize with TR’s core business, both in backward and forward integration. TR invests in companies supplying raw materials such as rayon-grade pulps. It also invests in companies using rayon as raw material such as PT Indo Liberty Textile (registered in Indonesia), a spun yarn manufacturer, Thai Polyphosphate Chemical which sells sodium sulphate, a by-product from rayon production.
This year, the company plans to increase its rayon production by installing 4th production line which is due to complete by the end of the year. The production capacity will be increased by 30%. To ensure the future supply of raw material, company invests in eucalyptus plantation in Laos which will bear fruit in 7 years. In addition, the company is looking for an opportunity to acquire rayon plants in China.
Appear To Be Undervalued
As of last Friday 26-May-2006, TR has market cap of 7100 million Baht (outstanding share is 201.6 million, share price is 35.25 Baht).
TR records the investment in associated companies by equity method of 4200 million Baht (Refer to Table below for details).
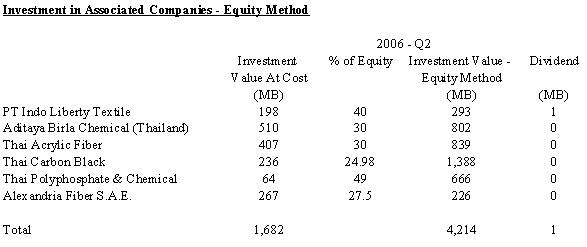 In addition, TR has long term investment in other companies in the amount of 1000 million Baht.
Cash and cash equivalent as of 31-Mar-2006 is approx 3000 million Baht whereas long term debt is roughly 120 million Baht, mainly the provision for its employee’s provident fund. However, the huge cash piling will be used for production increase and other investments as mentioned in the AGM.
*
Pause here for a while and do some maths. If I paid 7100 million Baht to acquire the whole TR, I will get the investment portfolio of TR and cash in the amount of 8200 million Baht. Oh…it’s good to be true, isn’t it? But it does not end here yet. Let’s continue scrutinizing.
*
Operating Profitability
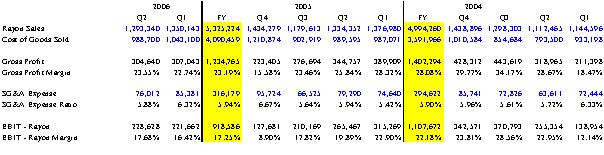
Rayon business generates EBIT for TR in the amount of 900 and 1100 million Baht in year 2005 and 2004 respectively. For the first half of 2006, the EBIT from rayon business is amounted to 450 million Baht.
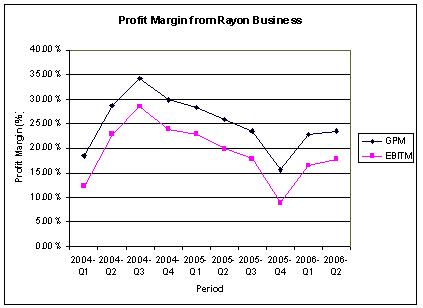
Gross profit margin from rayon is averaged at 25% (since 2004 till second quarter of 2006). For the first half of 2006, GPM is hovered around 23%. To get a clearer picture, the GPM for the whole year of 2005 is averaged at 23% with a high of 28% and gradually declined to 15.6% at year end. Despite sustained high fuel price, GPM for this year is getting better (See graph and table below for details).
SG&A expense ratio is around 5-7% since 2004. For the first half of this year, TR has SG&A expense ratio at 6.1% averagely. I think the management has done a good job here in controlling the cost.
TR Profitability Matrix – Rayon Business
 Threats
China is the biggest rayon producer in the world, having market share of 38%. In the next few years, China will become the net rayon exporter. To ride the China wave, TR plans to acquire existing rayon plants in China and convert them to suit TR’s production line.
The price of rayon very much depends on the supply of cotton. The company foresees a decline in rayon market price this year as a result of higher cotton supply. Furthermore, rayon has to compete with polyester as a substitute material.
High fuel price has led to the increase in production costs. Moreover raw material cost is also rising. It is the company’s plan to ensure that there is no disruption to the supply of raw material by investing in the backward linkages such as pulp and paper.
Valuation
Having discussed about the business of the company and threat that the company is facing now, it’s time to calculate the company intrinsic value.
First let’s take a look at Enterprise Value, which is “M.Cap – Cash + Long Term Debt”. This is the value that the outsider has to pay to acquire the company outright. As of 31-Mar-2006, its EV is approximately 4000 million Baht. The acquirer, paying 4000 million Baht to all shareholders, will entitle to the investment portfolio worth 5200 million Baht and rayon business which is able to generate EBIT of almost 1000 million Baht annually. In other words, there is a discount of about one-third when using the EV matrix.
Let’s move further on to the free cash flow generation. Free cash flow is the amount of money the company generates after deducting the capital expenditure. Warren Buffett calls it Owner’s Earnings (OE = Net Profit + Depriciation - CapEx). For the first half of 2006, TR is able to generate OE in the amount of 480 million Baht.
Assumed that OE for the whole year 2006 is 1000 million Baht, OE/EV ratio will be 25% (imply that you get all your money back in four years). If TR can maintain and grow its OE generation at this level, its OE/EV ratio will be gradually declined as a result of higher EV (thus higher market cap). TPCORP and WG are two examples where its OE/EV declines from 30% plus to 15% as a result of increase in its share price reflecting the company good performance in sustaining OE. In addition its OE/sales equals to 20%. Morningstar, a renowned US mutual fund, cited that for company having OE/sale greater than 5% it is considered as a cash cow. By this definition, TR appears to be a super cash cow.
Table below presents the history of Owner’s Earnings and OE/sales ratio since year 2000. The company manages to increase its OE every year except 2001. OE/sales ratio is consistently above 15% except 2001.
TR Owner’s Earning History
 *
*Take some times to respite if you feel your head starts spinning. Next step will involve more calculation to determine the estimated intrinsic value by discount cash flow method. Take a deep breath and let’s resume.
*
Discount cash flow (DCF) is used to determine the company intrinsic value. The intrinsic value is nothing but the free cash flow (or Owner’s Earnings) which the company can generate over its lifetime and discount back to the present value.
Assume that the company can grow its OE by 5% annually (rather conservative when compare with the growth rate of more than 10% during the past five years) and consider discount rate of 8%. The summation of the future OE for the next ten years discounted back to present is about 55 Baht. With the current share price hovering around 35 Baht, we have a discount of around one-third. Refer table below for the detailed calculation (Note that year 2005 results are used as the base year).
TR Intrinsic Value by Discount Cash Flow Method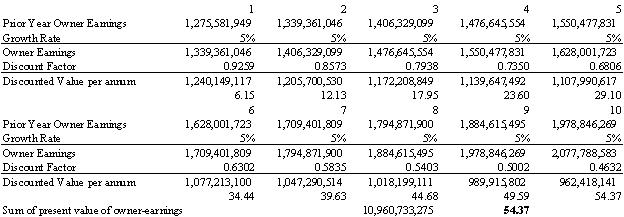
From the first two valuation matrices, enterprise value and discount cash flow, it appears that the market gives a 33% discount to TR’s intrinsic value.
In order to ensure that margin of safety is suffice, financial strength of the company is further analyzed. Table below presents the key financial figures of TR from 2002 to 2nd quarter of 2006, ending 31 Mar 2006. There are several aspects worth focusing which are:
- Asset and shareholder’s equity is rising by almost two folds without borrowing or raising capital.
- Extremely low leverage, D/E ratio only about 0.05.
- Revenue and net profit have been increased steadily.
- Possess Triple Double Characteristics i.e. ROA, ROE and net profit margin exceed 10%.
- It has been traded in the P/E range of 5 to 6 and P/BV below 1.
- Dividend yield is moderate, about 3% annually
It can be concluded from analyzing the company financial status that TR is a very rock solid company with very clean balance sheet.
TR Key Financial Figure (2002 to Q2 of 2006) in (Million Baht)
 Conclusion
It appears that TR is significantly priced below its estimated intrinsic value, partly because it is viewed with the attitude that it is in a sunset industry and facing a stiff competition from China. Although its net profit for the first half of 2006 is lowered than that of last year, with a very good performance record in the past and a visionary management team, I believe TR could be steered back to the successful path and strived in the competitive environment. Eventually, the market will recognize it, I believe. For value investors, when the offered price is very much lower than the intrinsic value with adequate margin of safety, we back up the truck and patiently wait for the gap to close.
![]()